Trade the World's Most Influential Markets with Confidence
Step into a world of unlimited opportunities with a platform designed to empower your ambitions and turn your vision into reality.

US Stocks
Invest in Top American Companies
Trade shares of the most iconic U.S. companies, including Apple, Tesla, Nvidia, and other market leaders driving American innovation and growth.
'%20fill='black'/%3e%3crect%20width='48'%20height='48'%20rx='24'%20transform='matrix(-1%200%200%201%2050%202)'%20fill='%23086EF9'/%3e%3crect%20x='1'%20y='-1'%20width='50'%20height='50'%20rx='25'%20transform='matrix(-1%200%200%201%2052%202)'%20stroke='white'%20stroke-opacity='0.12'%20stroke-width='2'/%3e%3cpath%20d='M33%2026L19%2026M33%2026L27%2020M33%2026L27%2032'%20stroke='white'%20stroke-width='2'%20stroke-linecap='round'%20stroke-linejoin='round'/%3e%3c/svg%3e)

FX
Trade the World’s Largest Financial Market
Access the global foreign exchange market with competitive spreads, deep liquidity, and 24/5 trading opportunities.

Indices
Trade Global Stock Market Performance
Access and trade major global indices like the S&P 500, NASDAQ, DAX, and more. Track economic performance across regions and capitalize on key market trends.

Commodities
Invest in Gold, Oil, and Agriculture
Diversify your portfolio with essential commodities like gold, crude oil, and agricultural products, ideal for hedging and long-term growth.

ETFs
Diversify Your Portfolio Instantly
Gain instant access to a wide range of global Exchange-Traded Funds (ETFs), from cutting-edge technology to essential energy sectors — all in one platform.
Rewarded.Twice.
by Global Financial Market Review.Thanks to our Clients, Partners and Employees.


| Symbol | Name | Ask | Spread (pips) |
|---|---|---|---|
 | Australian Dollar vs Canadian Dollar | - | - |
 | Australian Dollar vs US Dollar | - | - |
 | Euro vs British Pounds | - | - |
 | Euro vs US Dollar | - | - |
 | British Pounds vs US Dollar | - | - |
 | British Pounds vs Japanese Yen | - | - |
 | US Dollar vs Singapore Dollar | - | - |
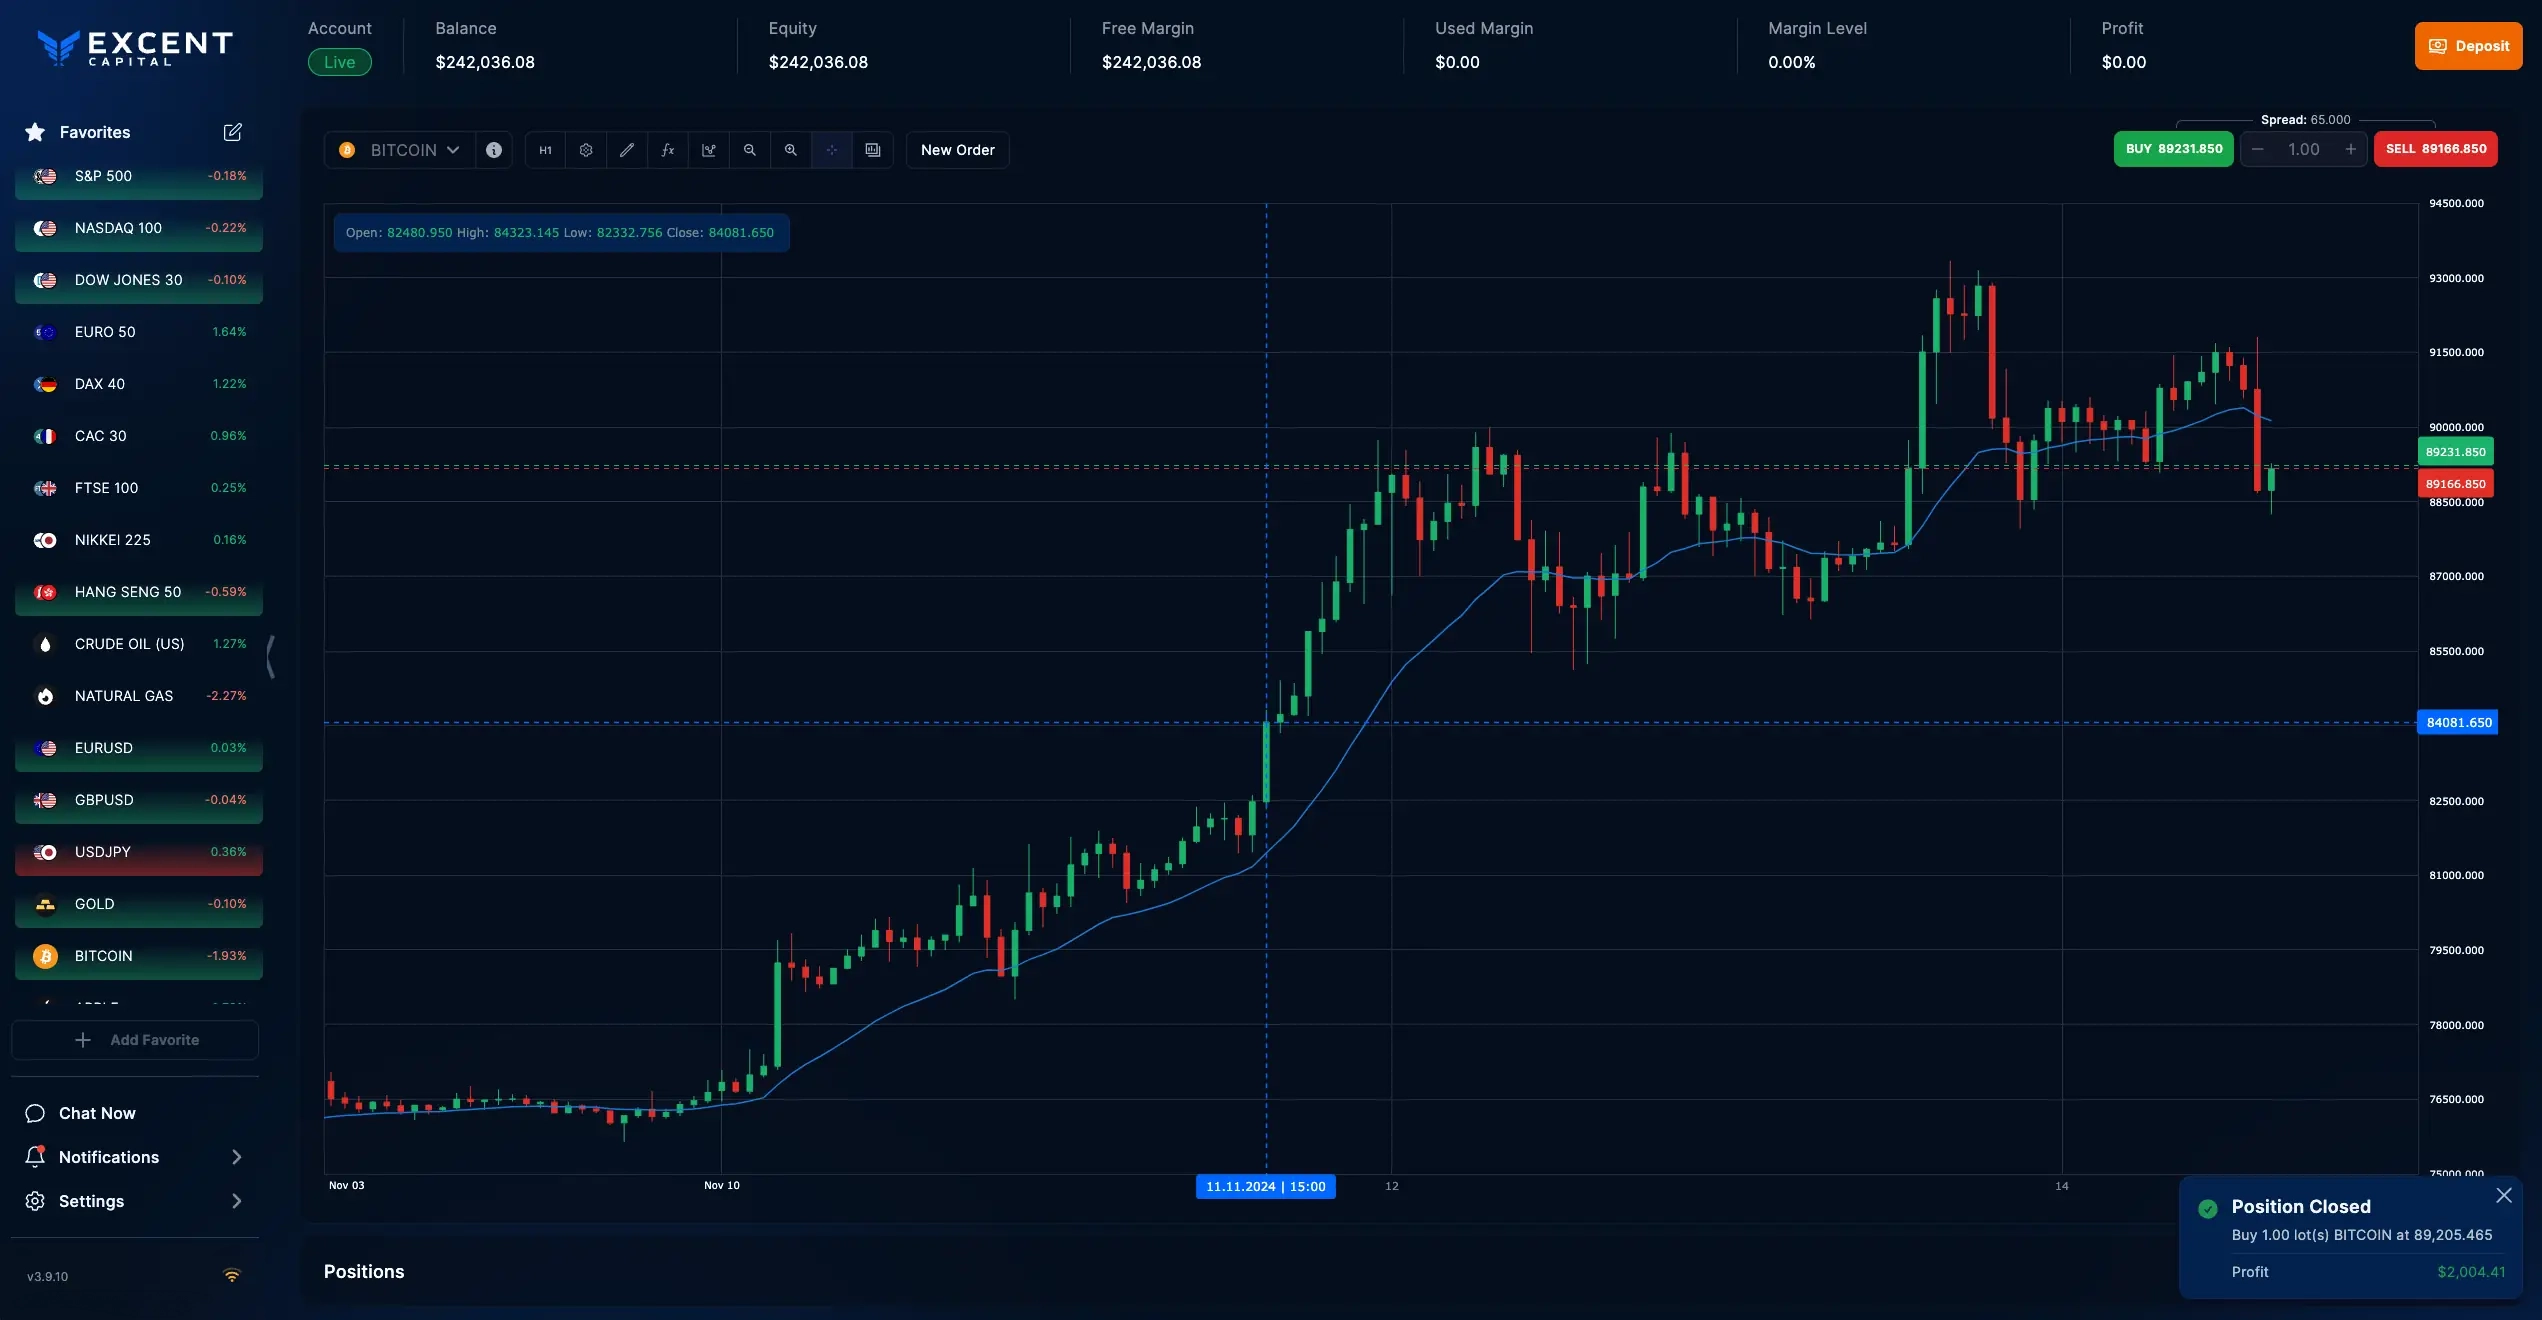
Trade In Most Important Global Markets
Don't lose a single
opportunity
Make Every Move Count
 No slippages
- The price you see is the price you get
- Leverage up to 1:150
- Micro lots for more flexibility
- Fast account fundings

Why Choose Excent Capital for investing and trading
Trade with Confidence and Clarity & Multiply Your Potential
Every trade is executed exactly as planned. No surprises, no slippage. You’re in control from start to finish. Whether you’re starting with $200 or scaling high-volume strategies, our flexible leverage and micro-lot options let you trade at your own pace, with your own rules.
A Platform Built In-House. Designed Around You.
We built our trading platform 100% in-house to give our clients what matters most: the freedom to trade your way, the speed to seize opportunities, and the trust to build your future.
Every feature is engineered with you in mind, combining cutting-edge technology, real-time responsiveness, and personalized trading tools.
Personalized Trading Experience
High-Speed Performance
Security & Compliance
Faster Support
Even More Benefits

Connectivity and APIs

Guaranteed Stop-Loss & Take-profit
Easy-to-use interface and features

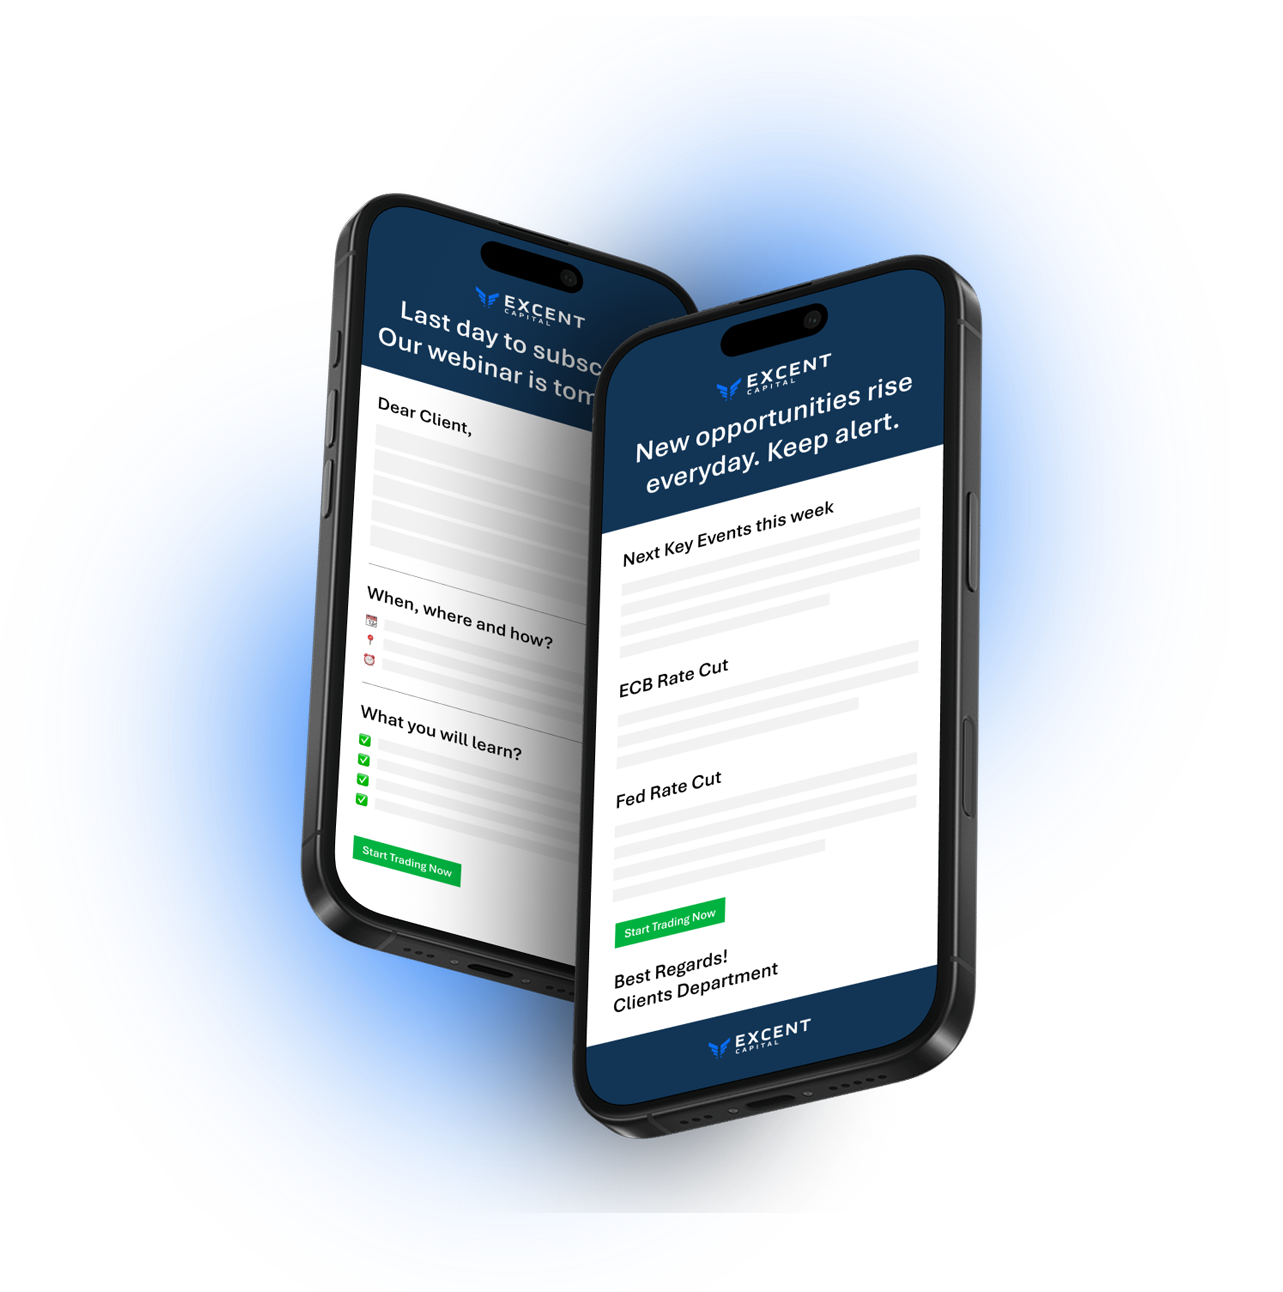
Top-Movers of the day
Learn more about trading secrets that only Excent Capital tells you
Ready to Take the Next Step in Your Trading Career?
At Excent Capital, we turn what-ifs into strategic wins.
Whether you’re just starting or scaling up, we’re here to help you seize the moment, capitalize on market shifts, and grow your wealth with purpose.
Don’t let the next opportunity pass you by — trade with Excent Capital and shape your financial future.
Join Us Tooday